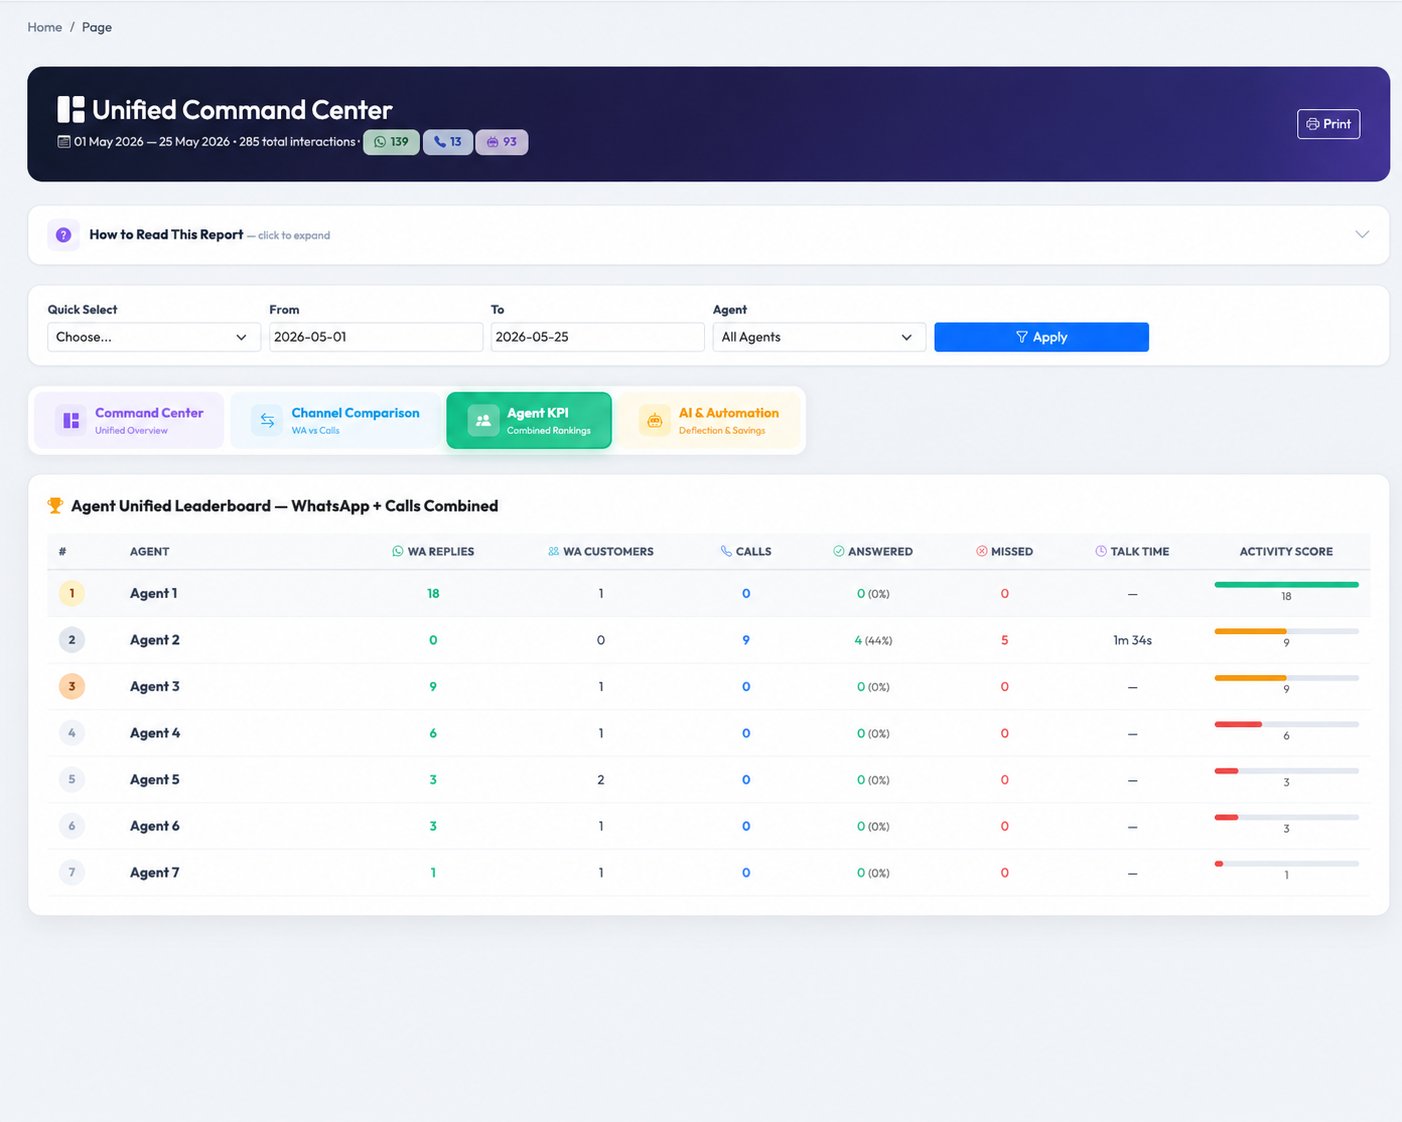
① Report · Boss view
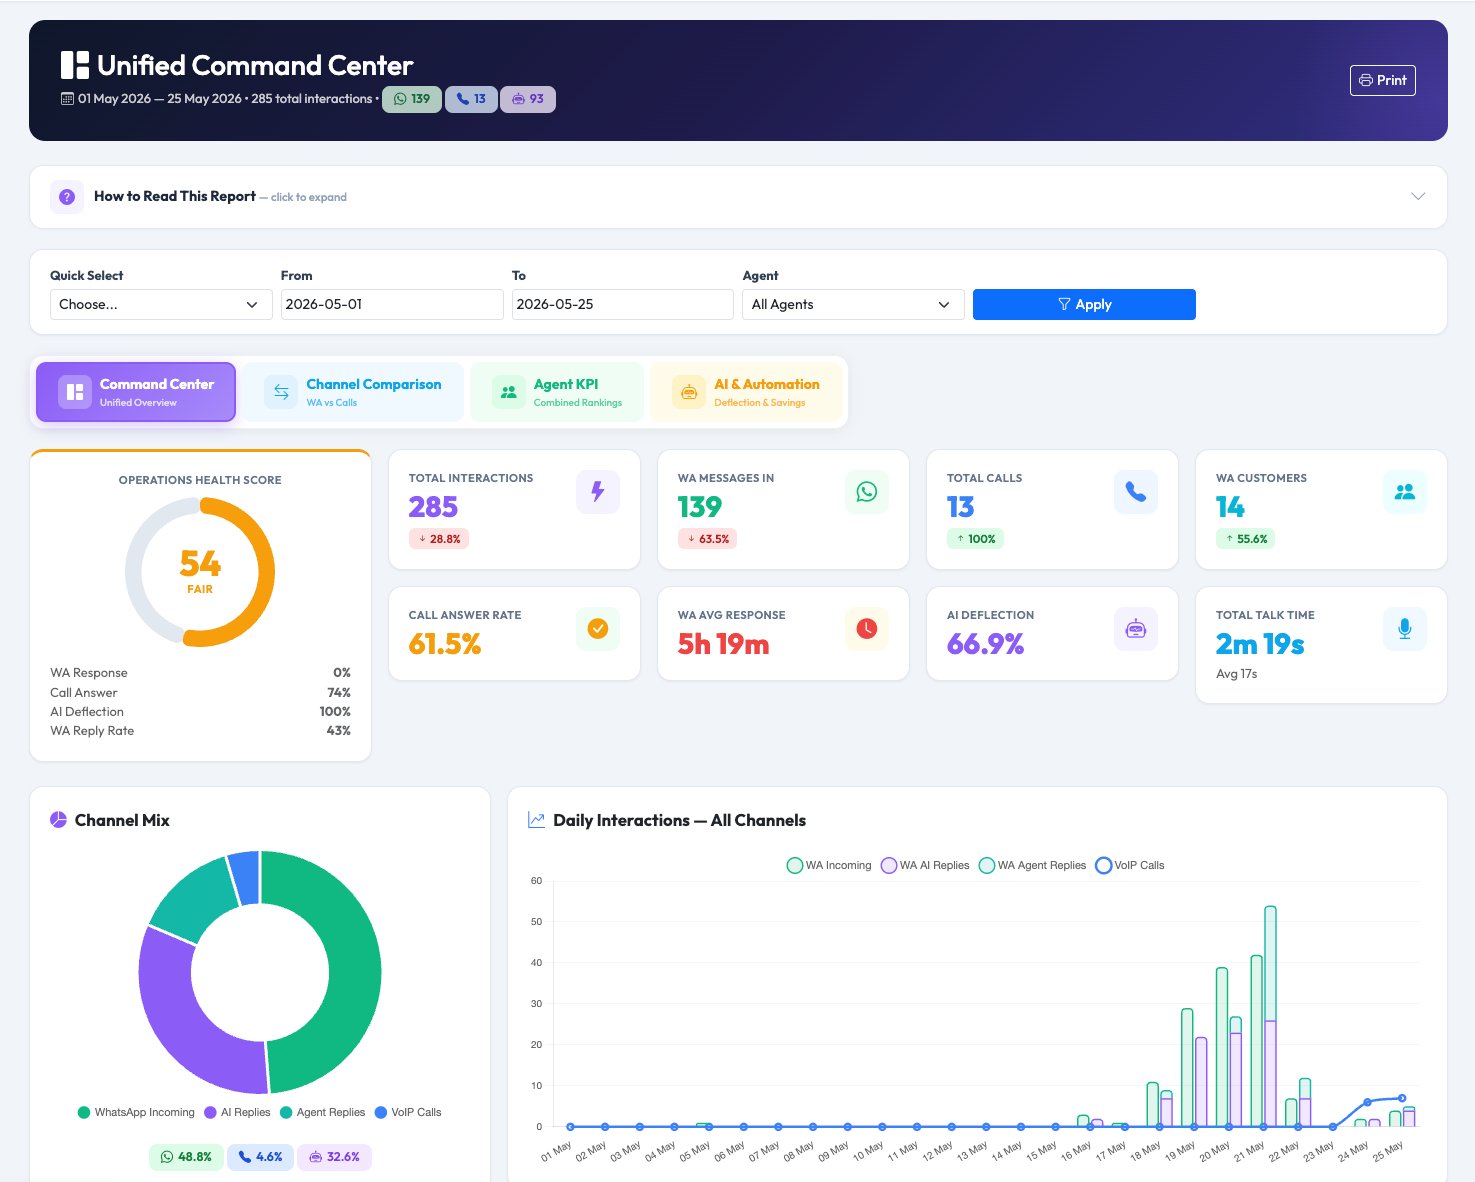
Unified Command Center
The health score for your entire operation
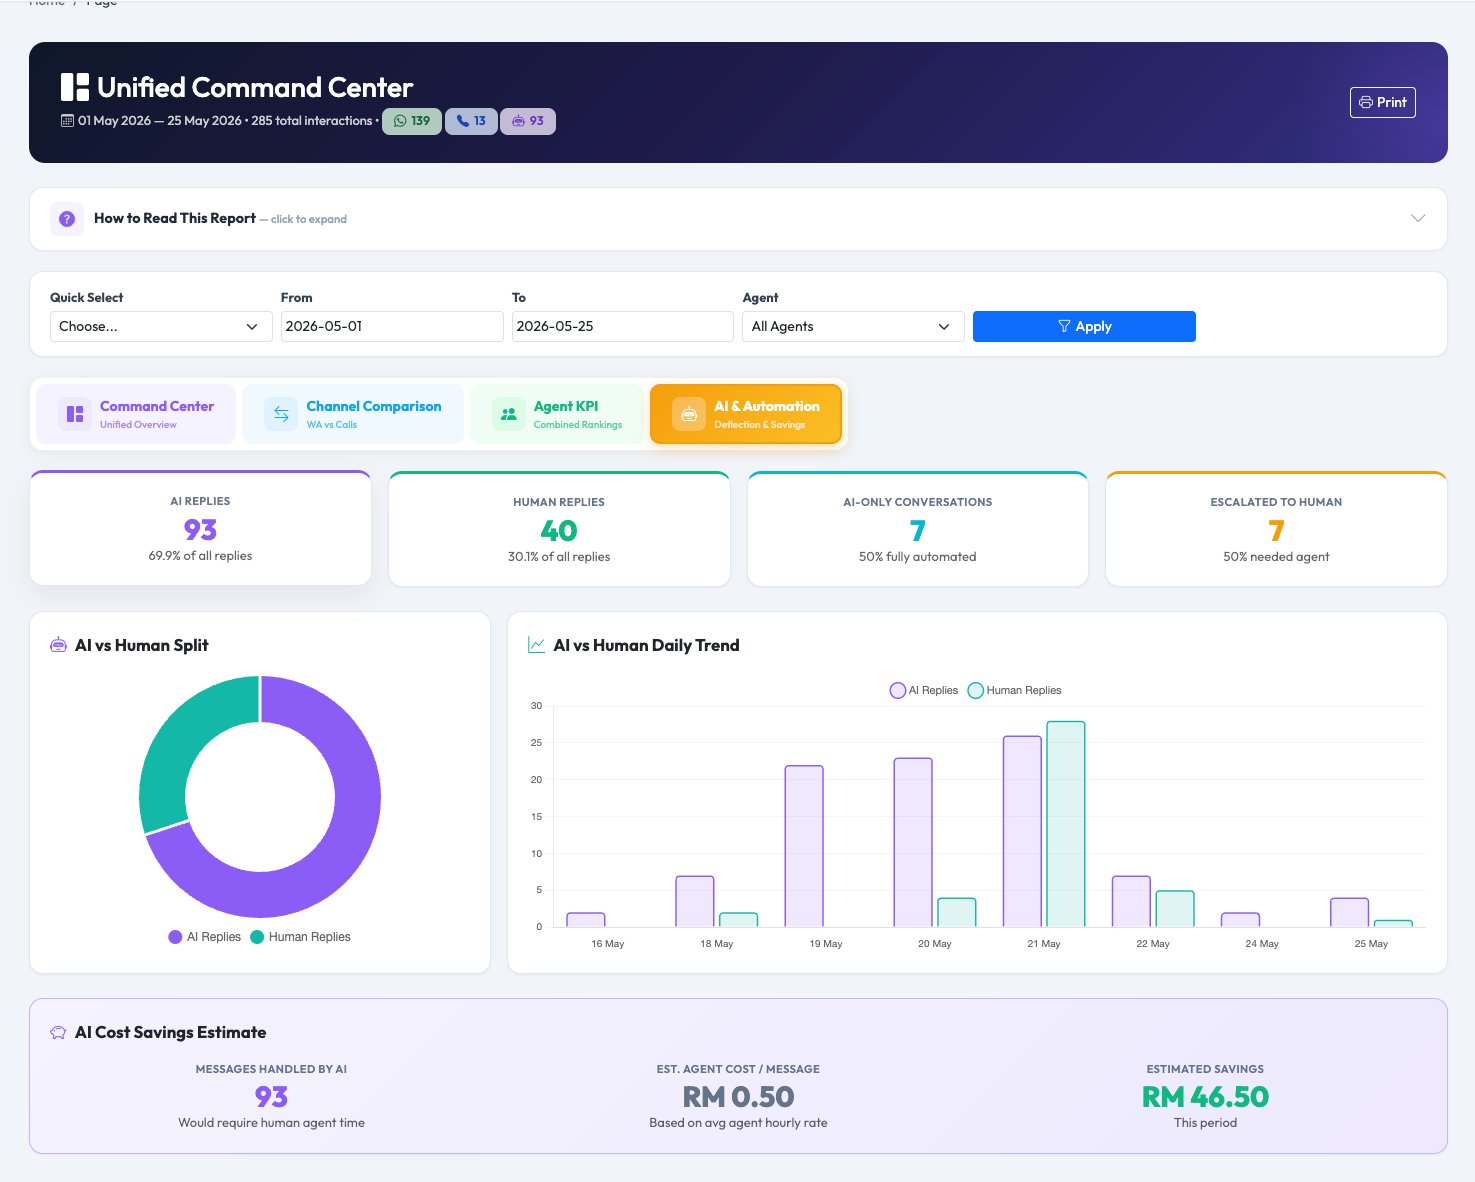
Health score 0–100, 8 KPI cards with period-over-period arrows, channel mix doughnut, daily combined trend chart, and AI cost savings — all in one executive dashboard.
One 0–100 health score for your entire operation
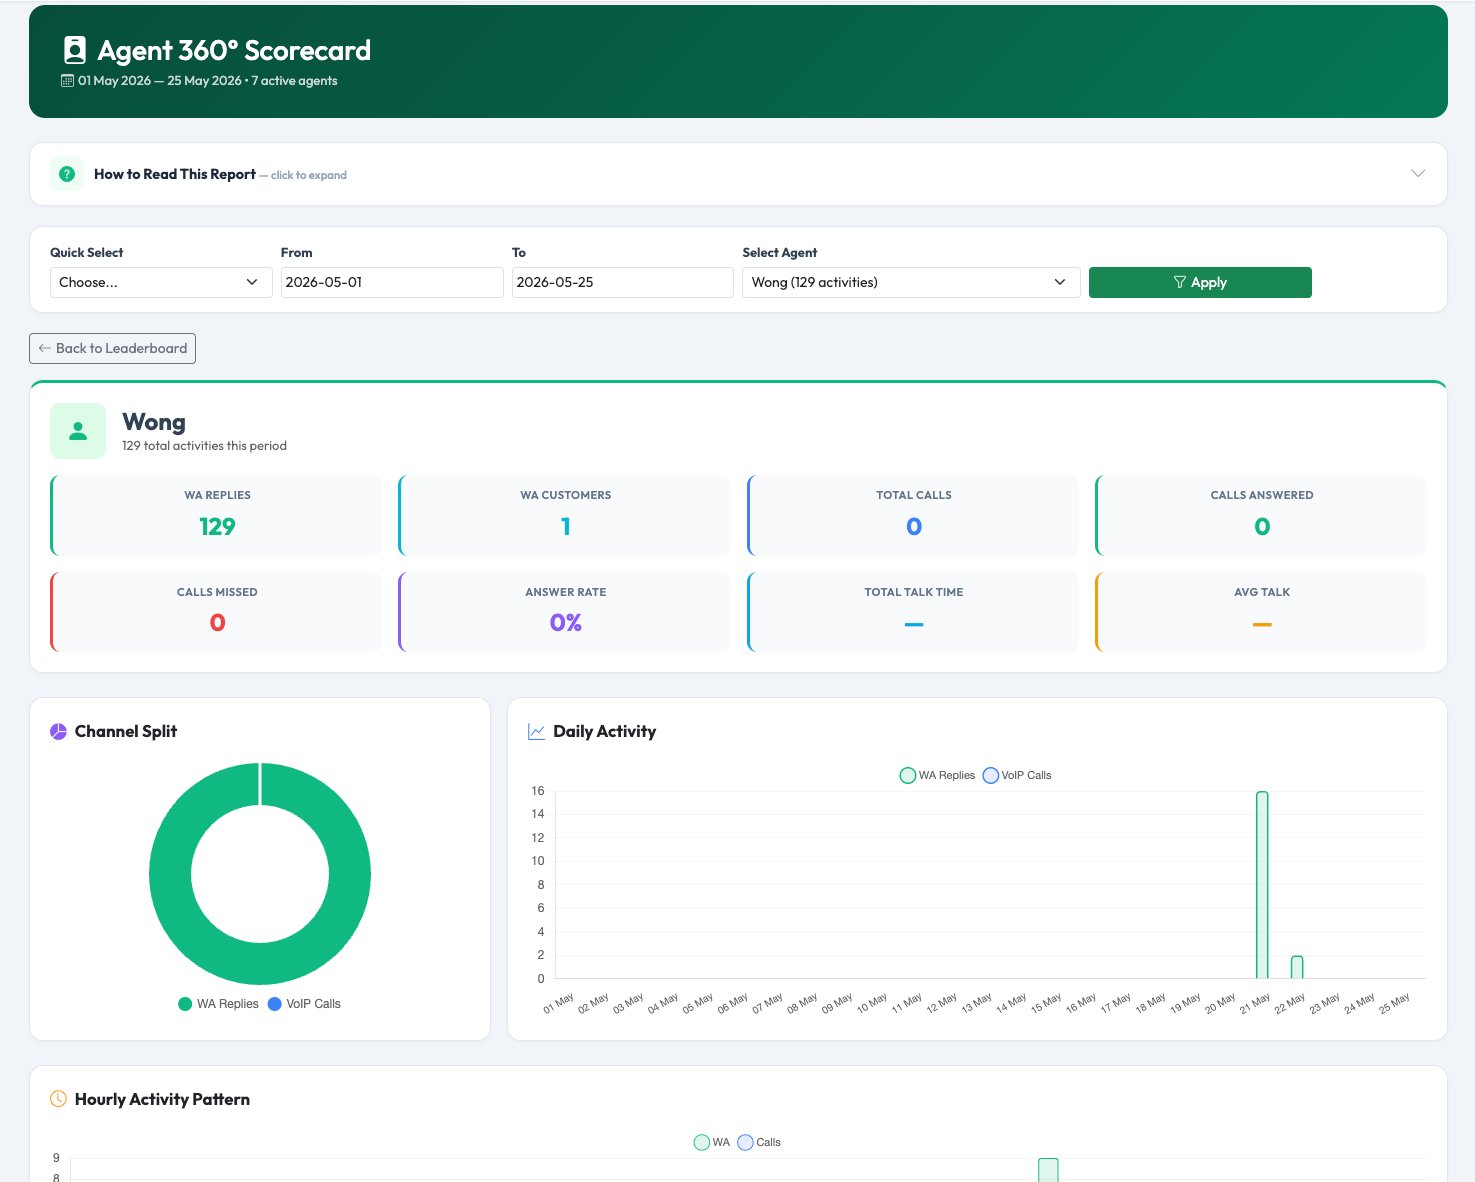
② Report · Staff accountability
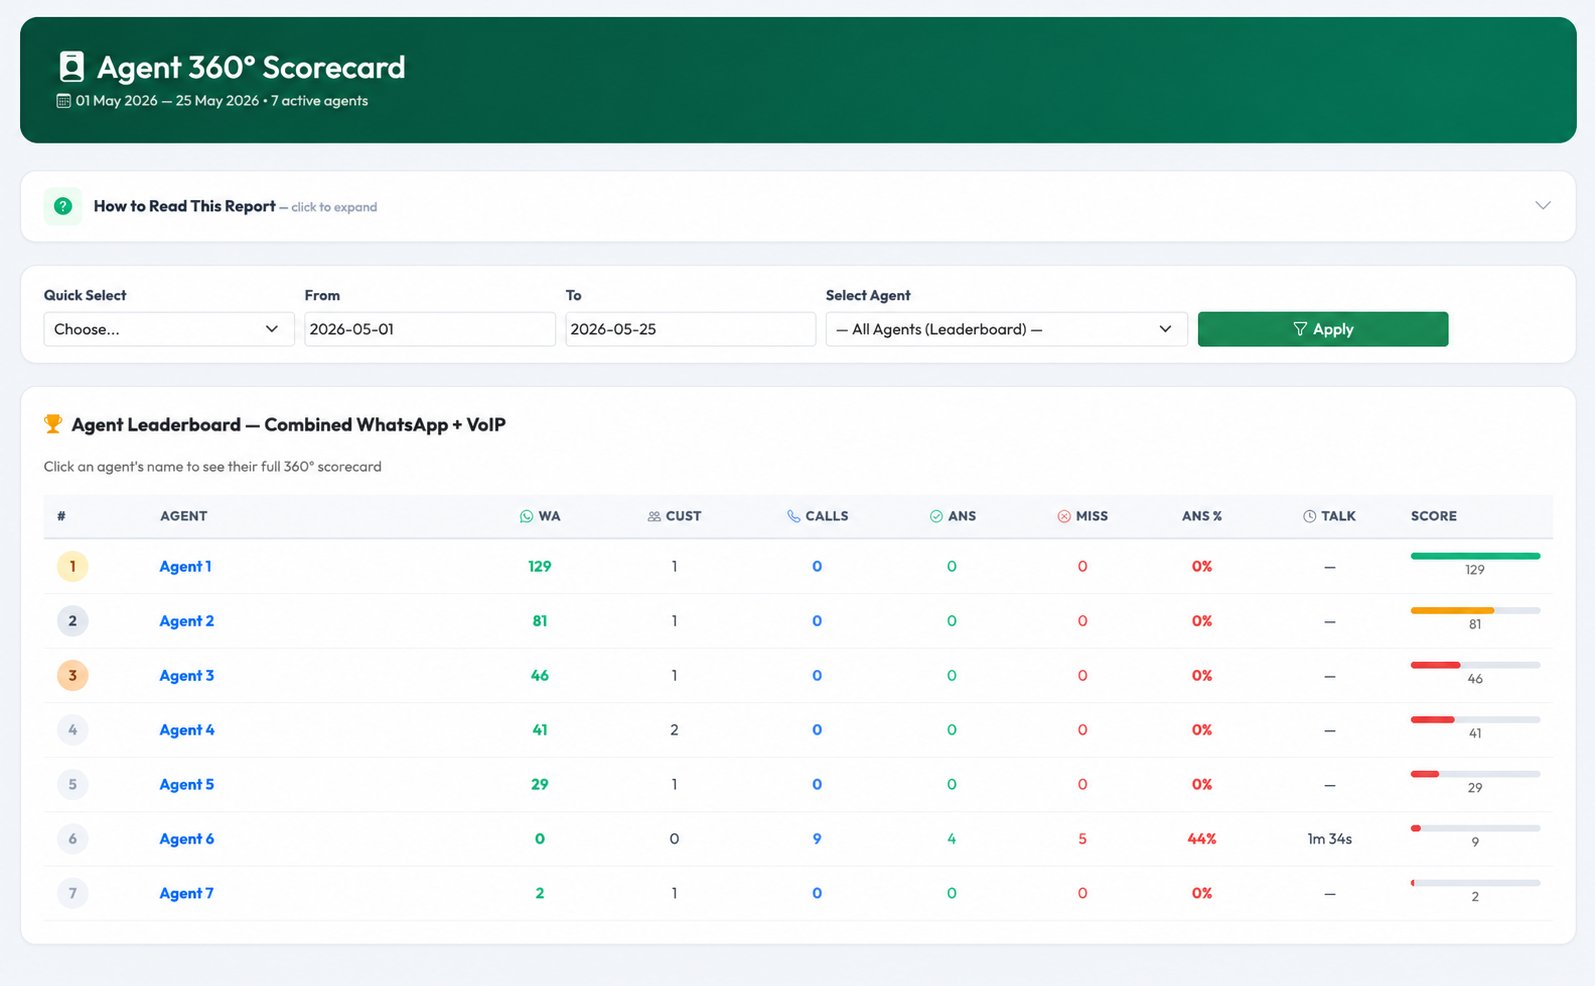
Agent 360° Scorecard
Combined WhatsApp + VoIP per agent
Unified leaderboard ranking agents by WhatsApp replies + VoIP calls. Click any agent to drill into daily patterns, channel split, answer rate, talk time, and customer count.
Compare agents across WhatsApp and calls in one table
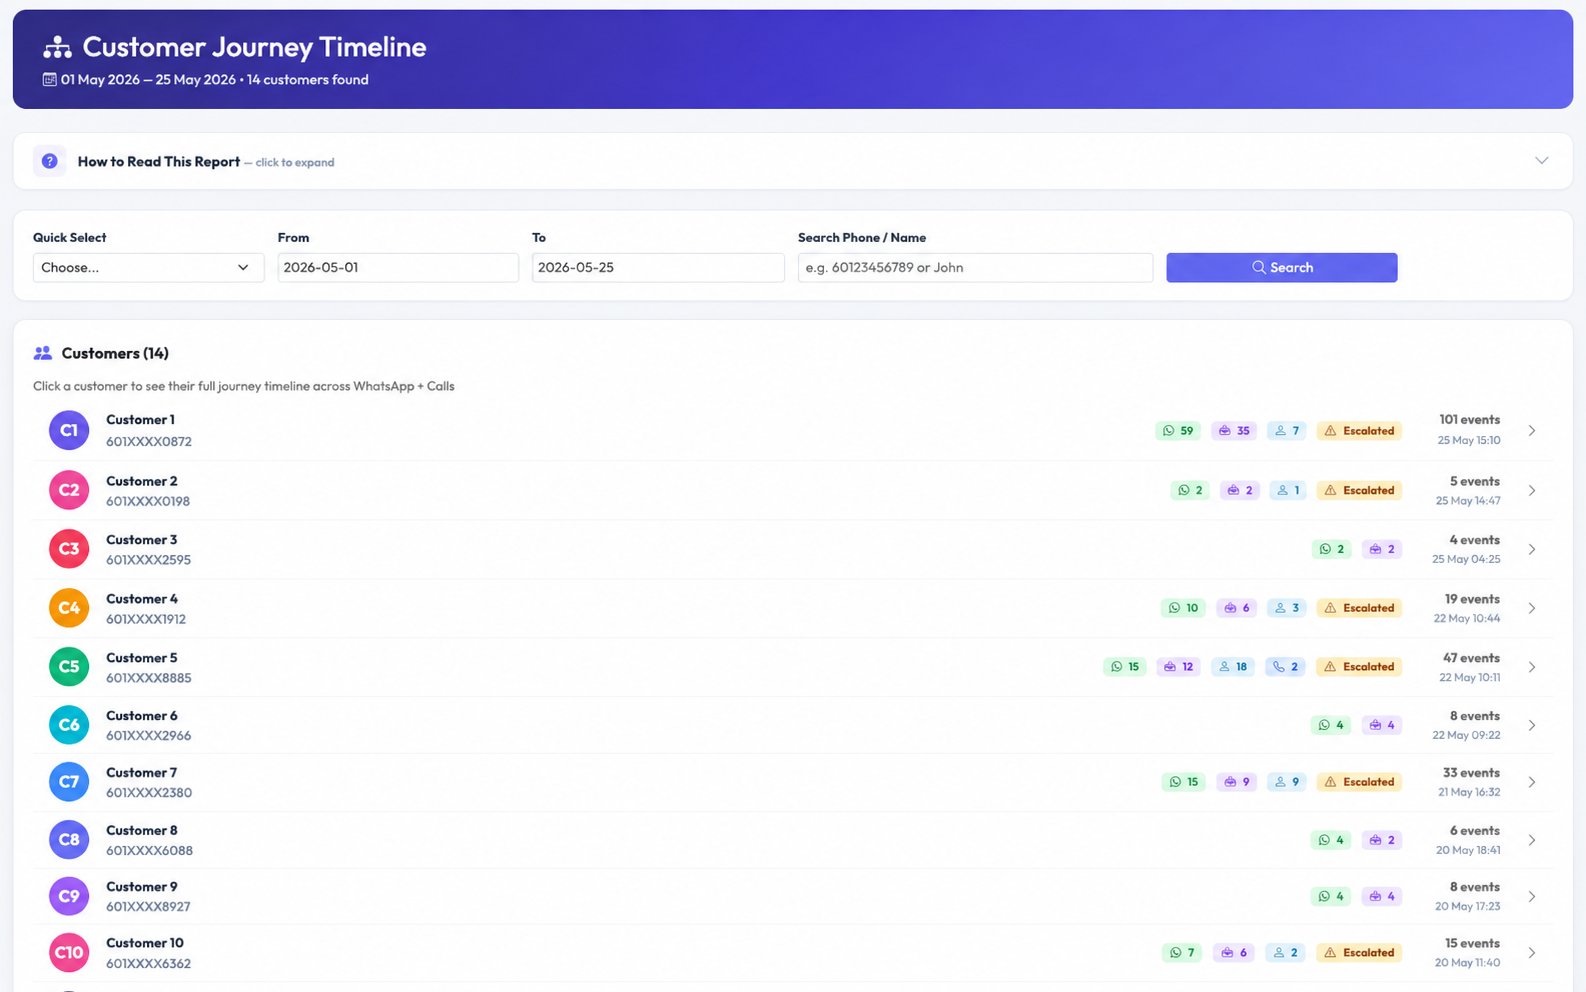
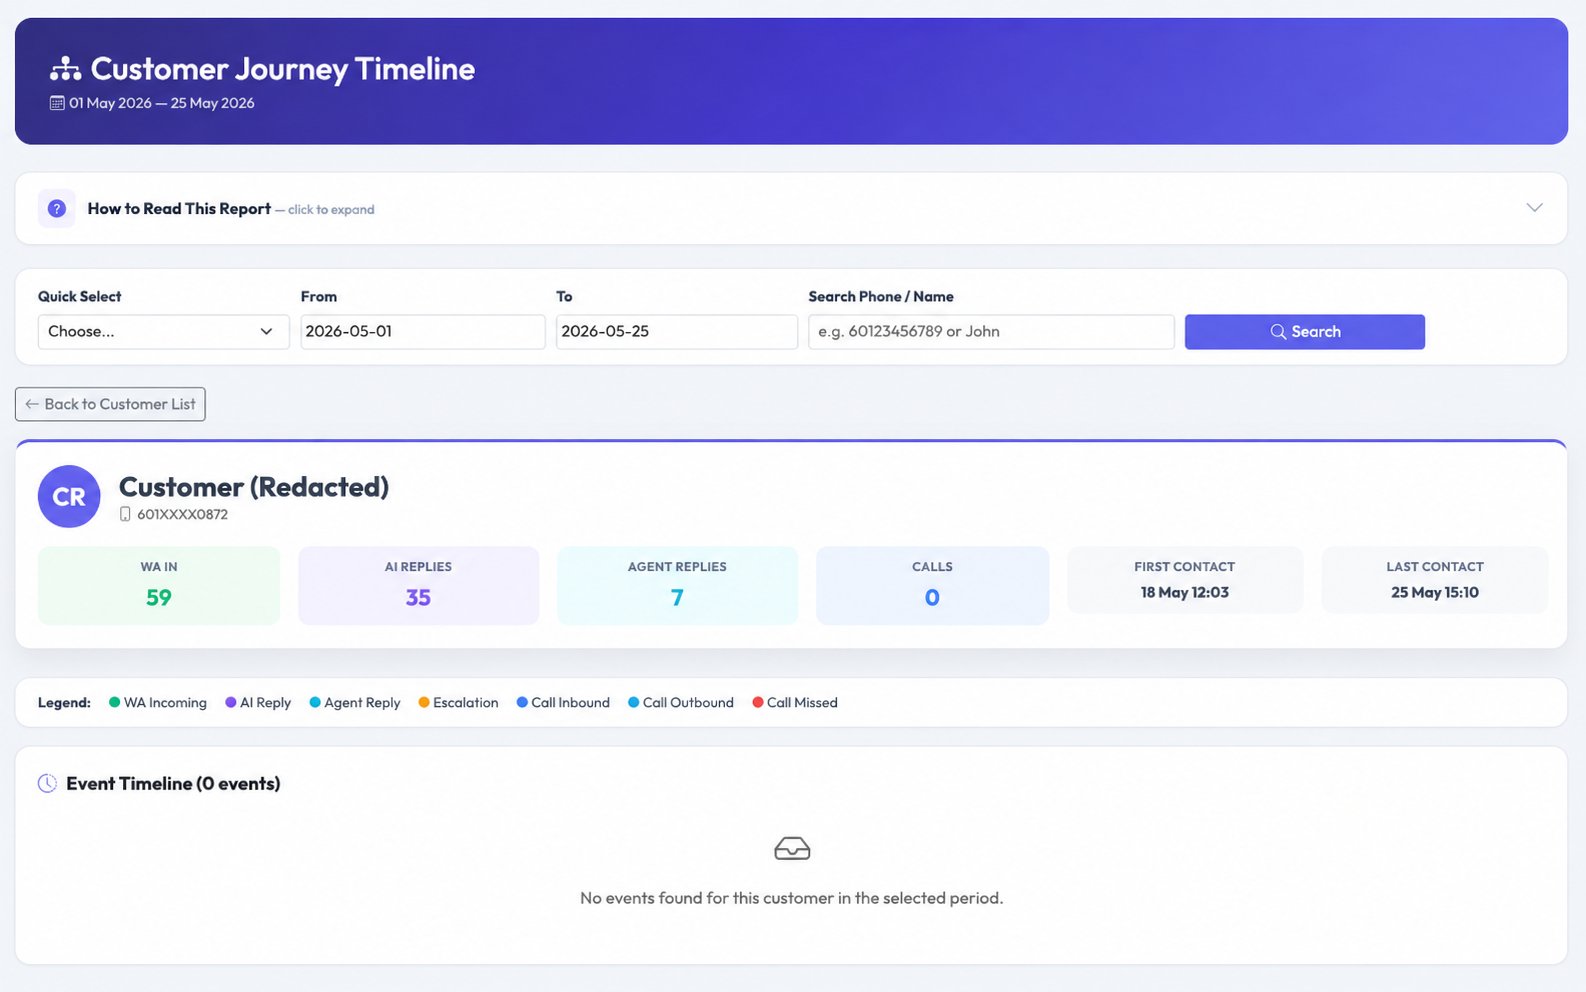
Customer Journey Timeline③ Report · Customer insight
Customer Journey Timeline
Every touchpoint for any customer
Search by phone number and see a merged chronological timeline of WhatsApp messages, AI replies, escalations, and phone calls. Understand exactly how each customer was served.
Track a customer from first WhatsApp message to call resolution
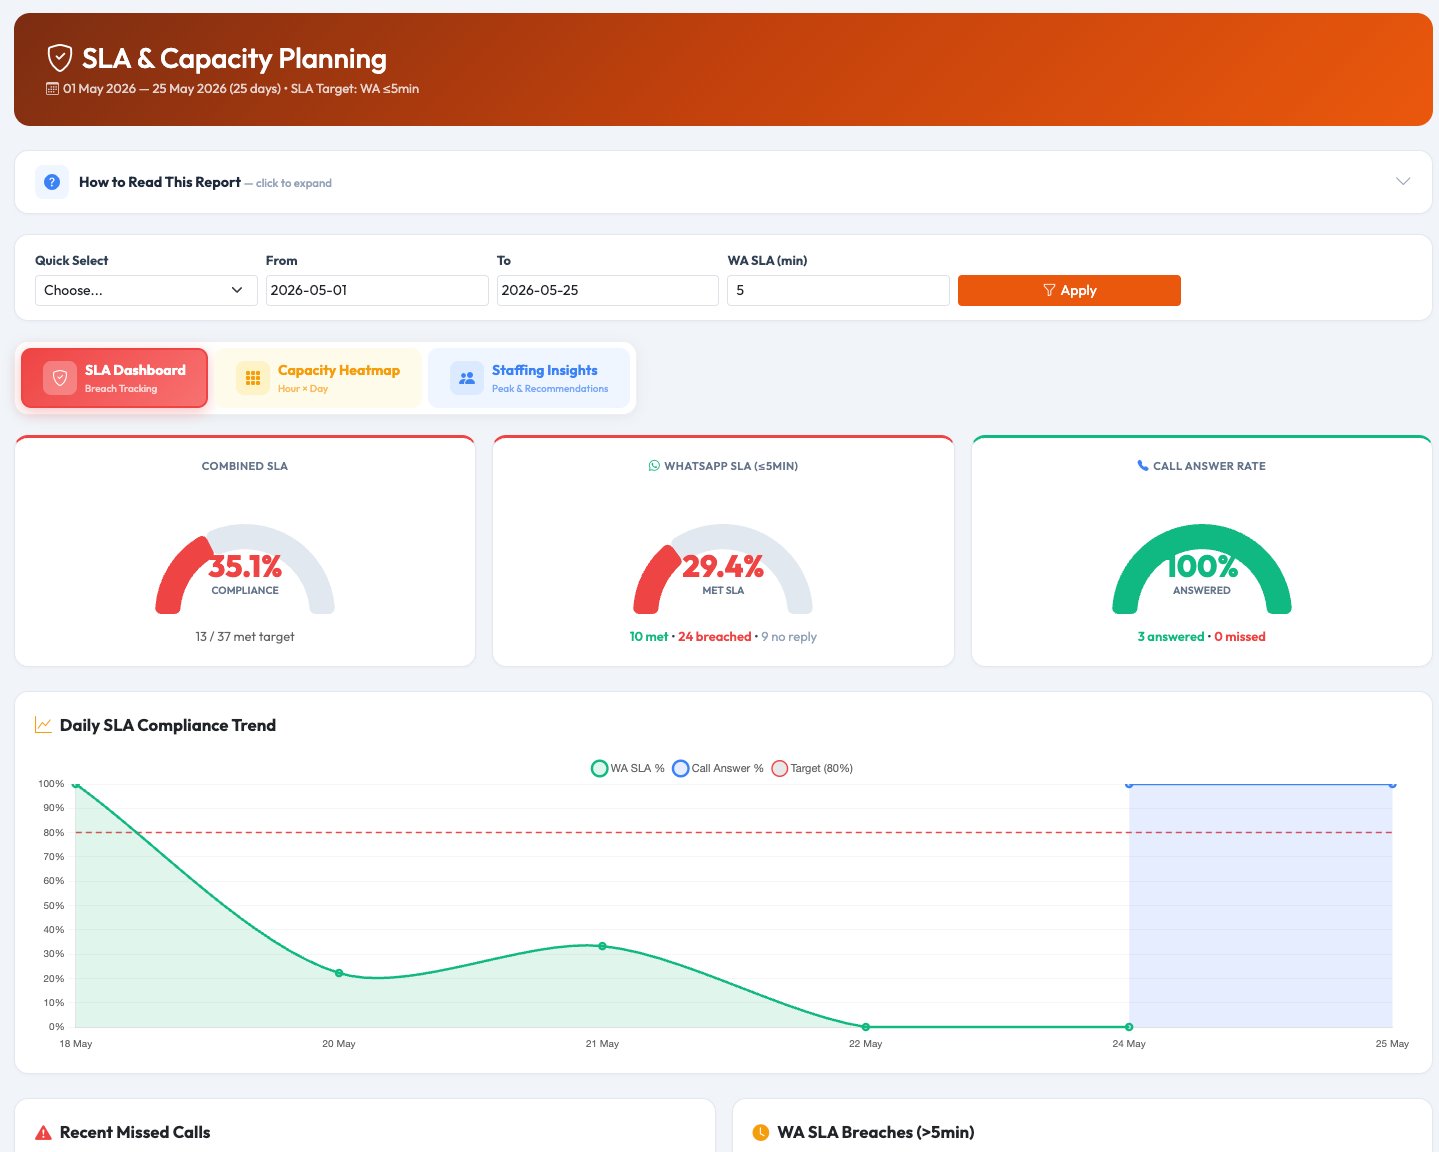
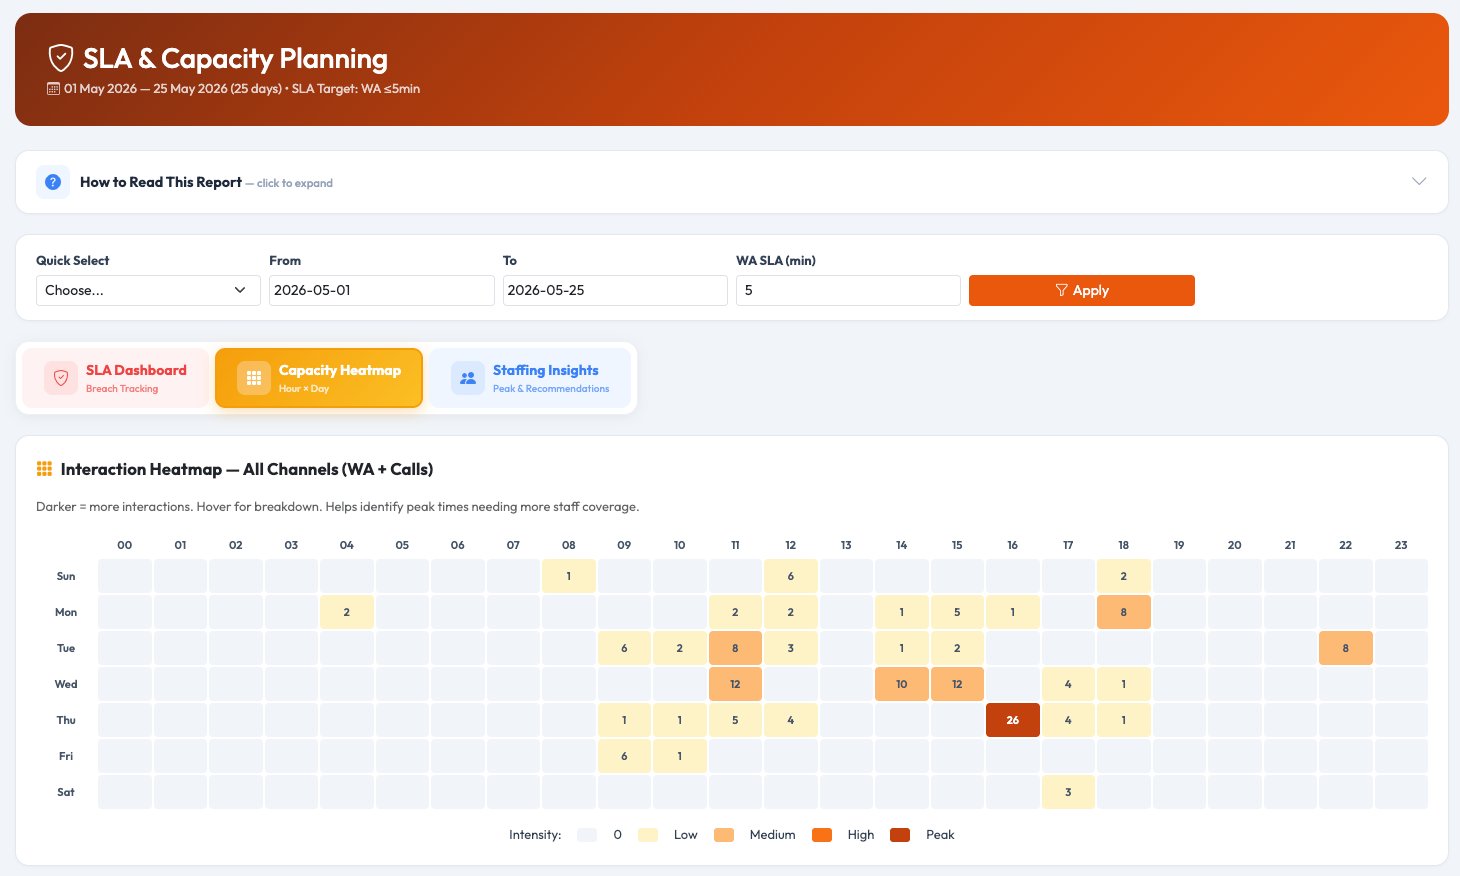
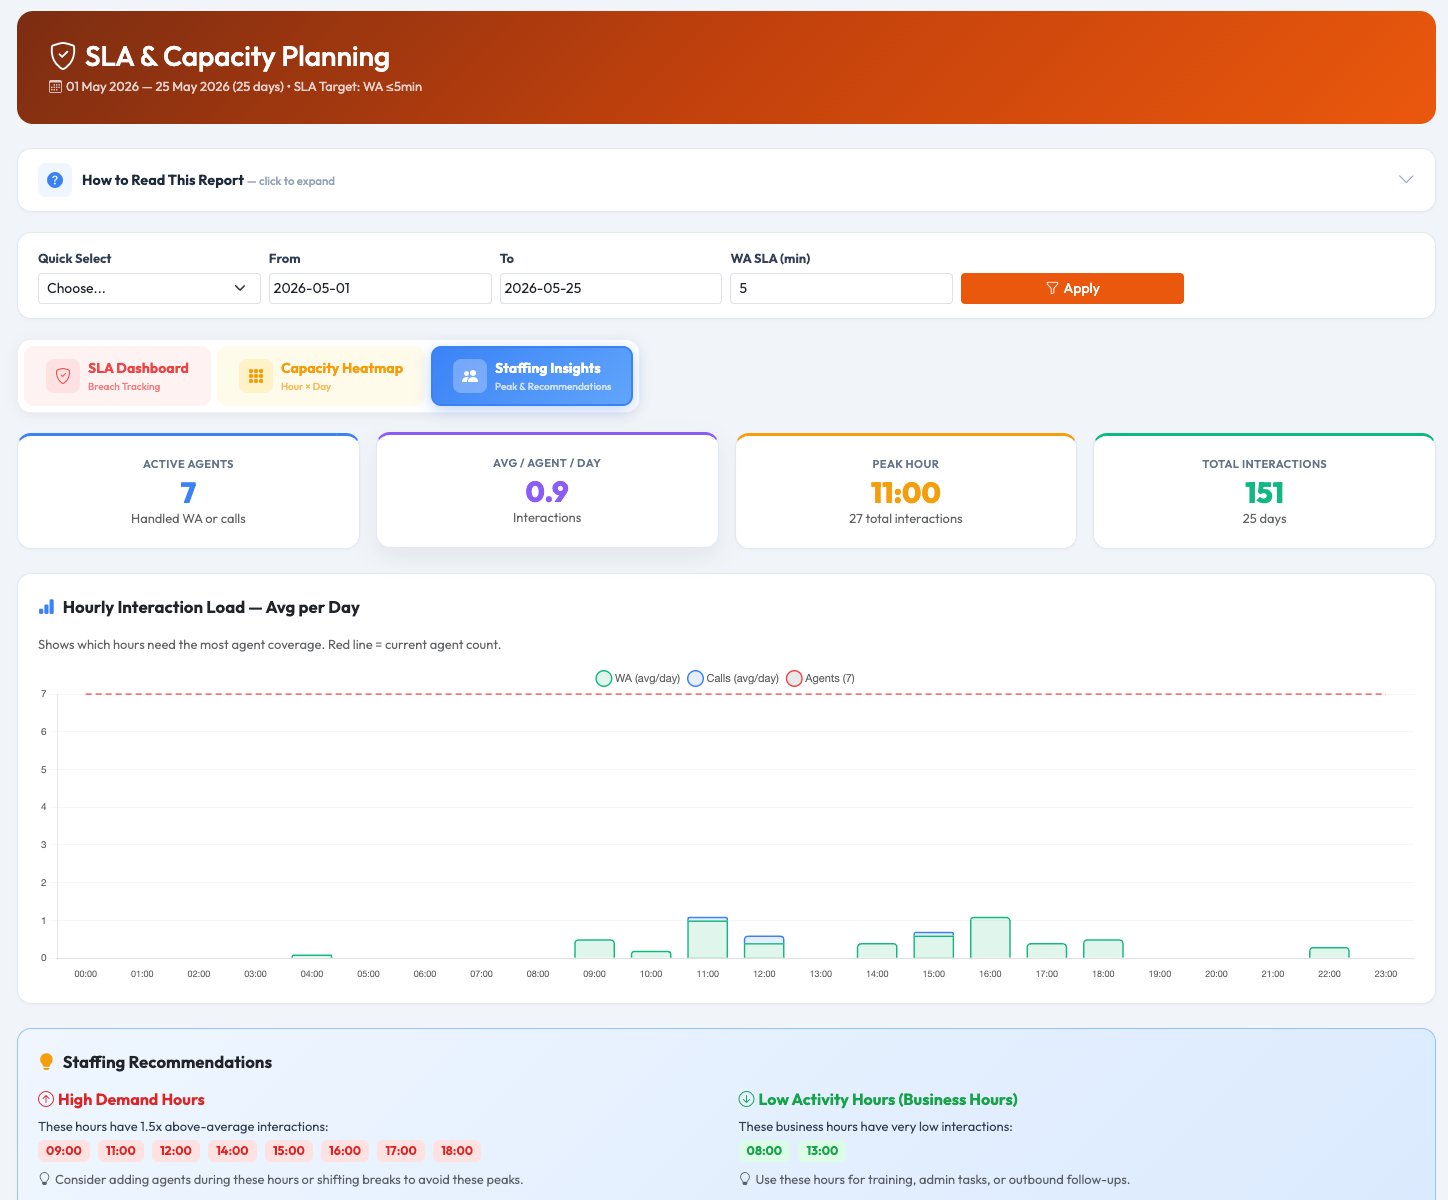
④ Report · Staffing & SLA
SLA & Capacity Planning
Never miss an SLA target again
Track WhatsApp response SLA and call answer rates with visual gauges. 7×24 capacity heatmap identifies peak hours. Automated staffing recommendations — red for high demand, green for low.
Automated staffing recommendations based on real data